VI
VIGraph
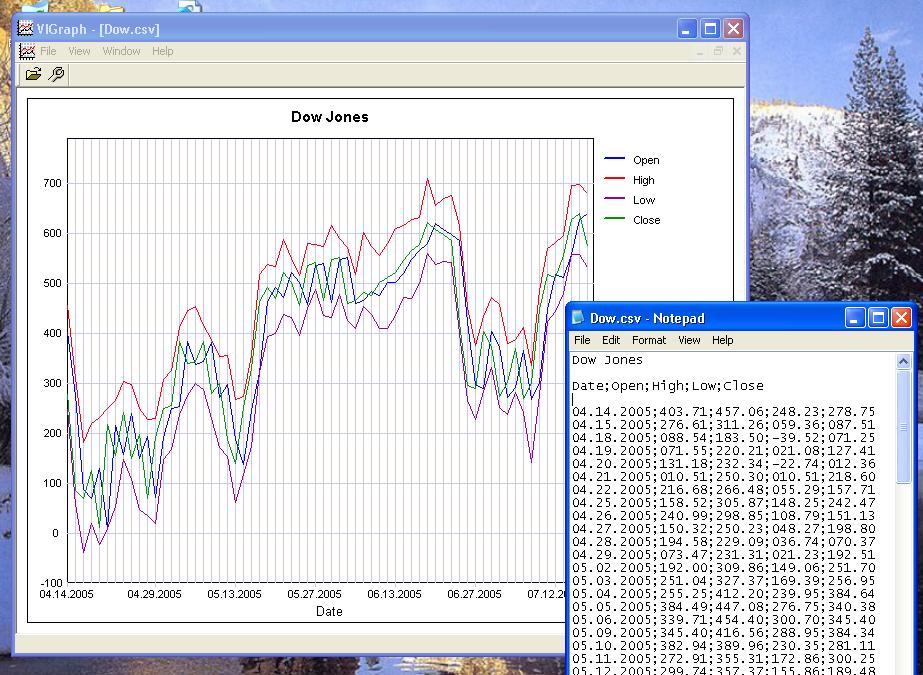
v1.0VIGraph It draws a diagramms from your txt-data files. It scales your diagramms automatically or manually. Simply make a txt or csv (ASCII) file like that: Dow Jones Date; Open; High; Low; Close 4.14.2005; 10403.71; 10457.06; 10248.23; 10278.75 4.15.2005; 10276.61; 10311.26; 10059.36; 10087.51 Run VIGraph and open that file. You will get a diagramm with 4 colored lines (for Open; High; Low; Close).
Description
It draws a diagramms from your txt or csv data files. It scales your diagramms automatically or manually.
You can open as much data files as you need simultaneously. Columns in the txt-files can be divided by commas, tabulators or semicolons.
You can open as much data files as you need simultaneously. Columns in the txt-files can be divided by commas, tabulators or semicolons.