DE
DebugBar
v5.1The DebugBar is an Internet Explorer toolbar which brings new services to surfers and professionals : * Surfers : zoom, direct Web search , email page screenshots , color picker * Developers : view HTML code, cookies, Javascript, HTTP/HTTPS headers, misc infos
Description
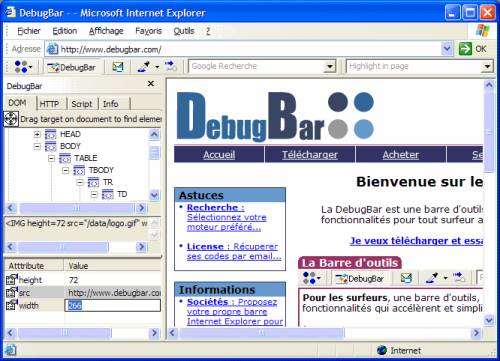
The DebugBar is an Internet Explorer toolbar to increase web dev productivity : The Toolbar ================= For all surfers, a toolbar in Internet Explorer brings new and faster functionalities for more productivity on usual tasks on the Net : * Zoom on the current web page * Send in one click a screenshot of the current Web Page by email. * Send in one click a screenshot of the current ENTIRE Web Page (including hidden scrolled parts) by email.
* Search directly with your prefered web search engine * Find a word in a web Page with the "Highlight in page" function * Get the color code of any pixel in the web page and anywhere on the screen. * Get script errors notification and send a screenshot with useful debugging information for developers in one click !
The development bar ========================= For professionals, a development bar placed on the left of the Internet Explorer window gives you important informations to reduce development and debug time of your web sites : * Directly view the DOM tree of the loaded document with syntaxing colored HTML/JScript/VBScript/CSS code . * Retrieve an HTML tag directly on the page by using the "Target" * Access tag attributes, modify them and view the result direcly in Internet Explorer withou reloading the document * View external Javascript and CSS files attached to the document.
* View Internet Explorer HTTP and HTTPS requests and Web Server responses * View defined cookies in the current loaded page * View all the Javascript functions defined in the page and their source code * Run Javascript code by using the interactive Javascript console * Get useful informations (download time, number of images, images size) on the downloaded page